Overview
In this demonstration we will use the Agilicus Connector to securely, simply expose a Grafana service running inside a Kubernetes cluster.
This will work for clusters that have no Ingress, no LoadBalancer, no public IP. It will allow you to add any user, from any identity provider, with a simple single-sign-on. If you push alerts via a Chat channel, you can just click on the link to get to the graph, no VPN.
First, install the Agilicus Connector in your Kubernetes cluster.
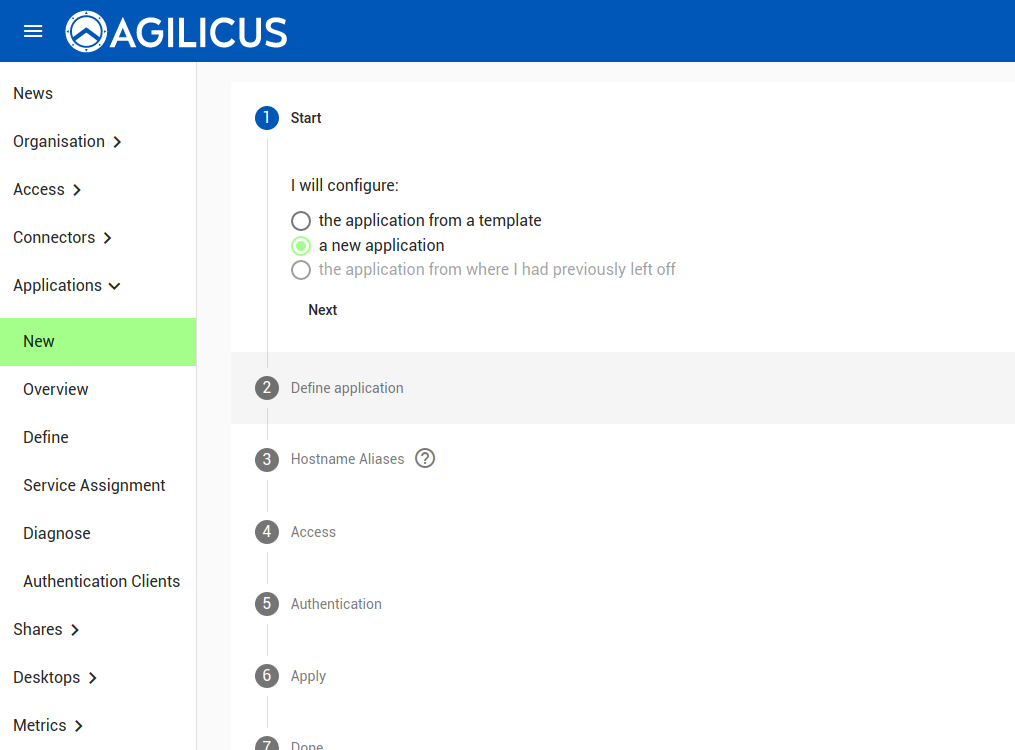
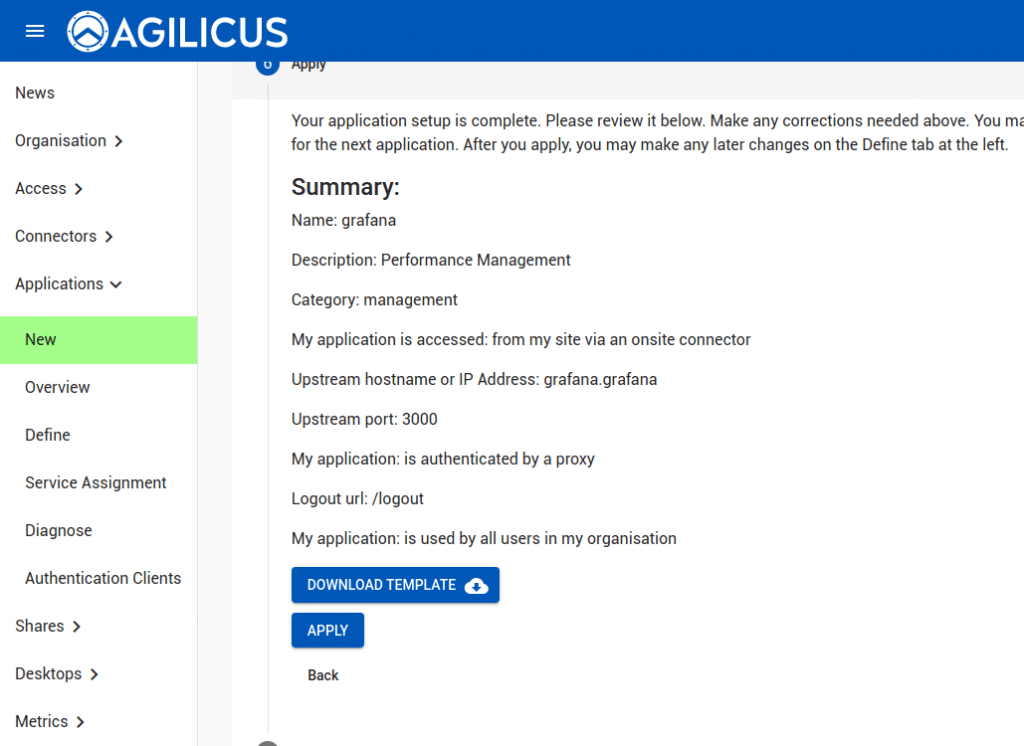
Second, create the Grafana Application in the Admin web interface.
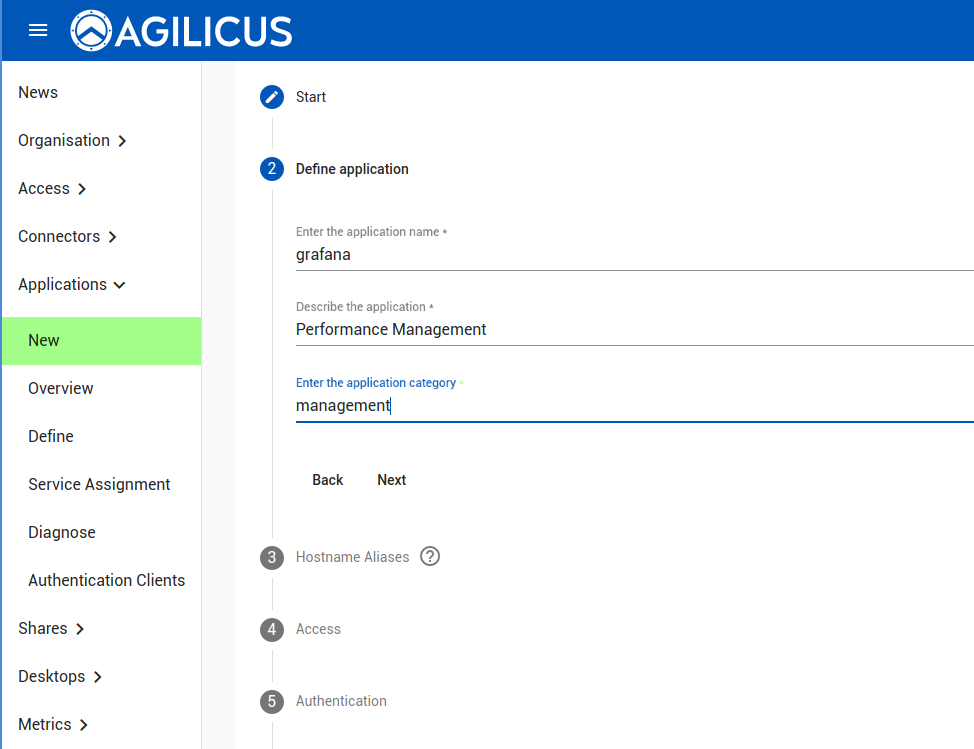
The application name will become the hostname (e.g. here we will have https://grafana.MYDOMAIN)
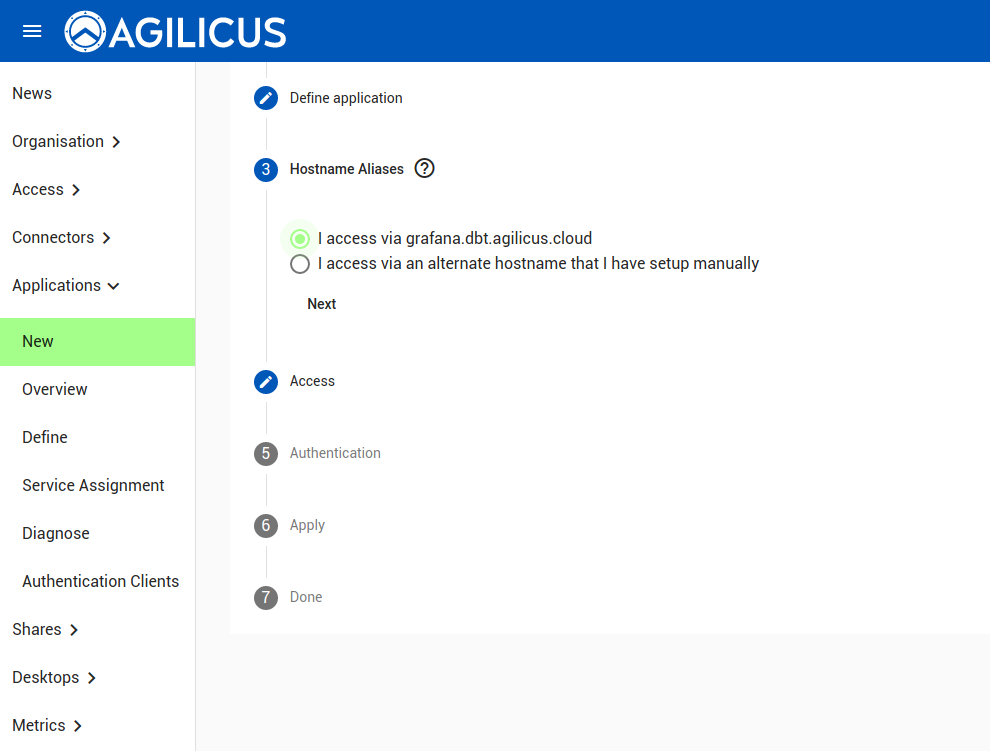
You may use a pattern-based name (APPNAME.MYDOMAIN), or, a specific hostname (e.g. my-grafana).
Here we will use the Kubernetes Connector we created earlier.
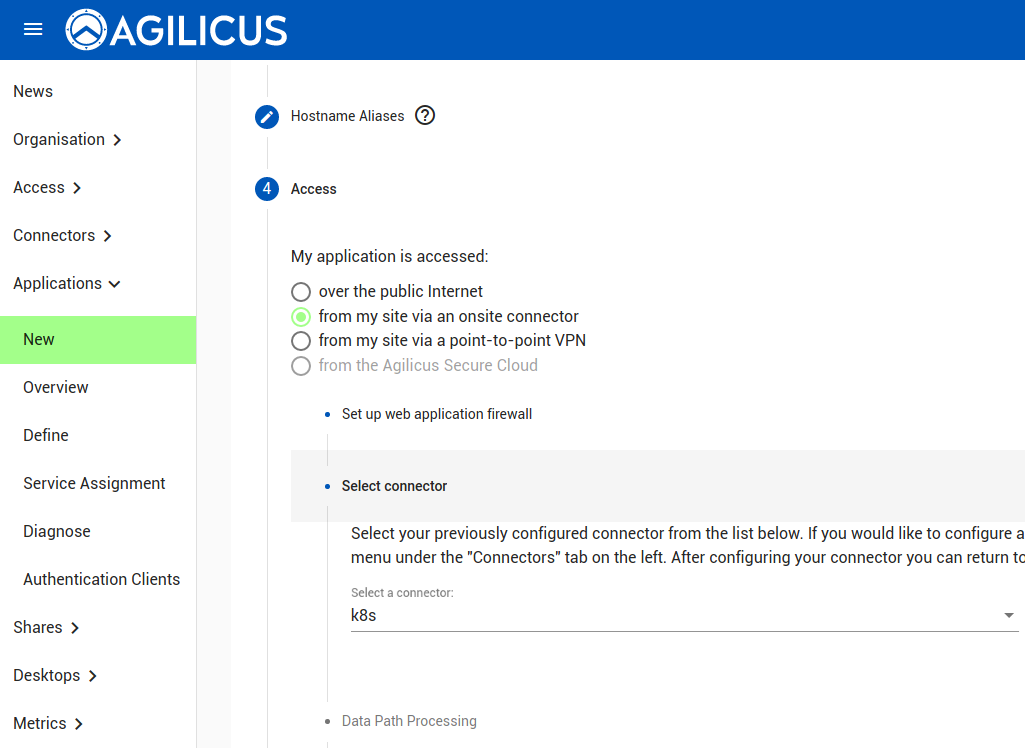
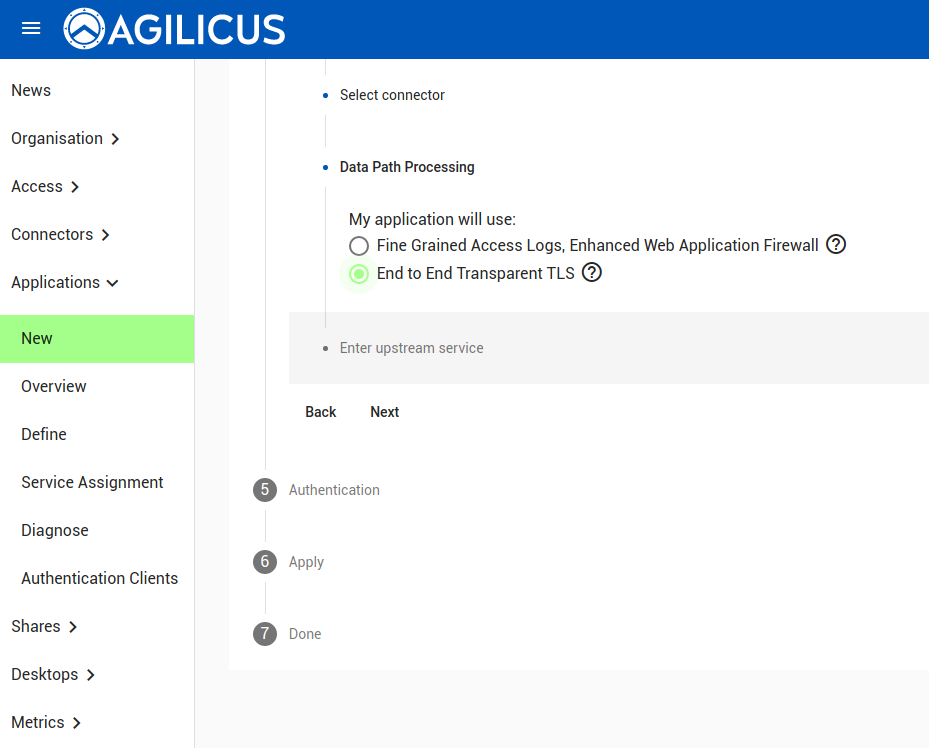
For this demonstration we use TLS from user to the connector in your Kubernetes cluster. If there is a desire for fine-grained audit, use the other option.
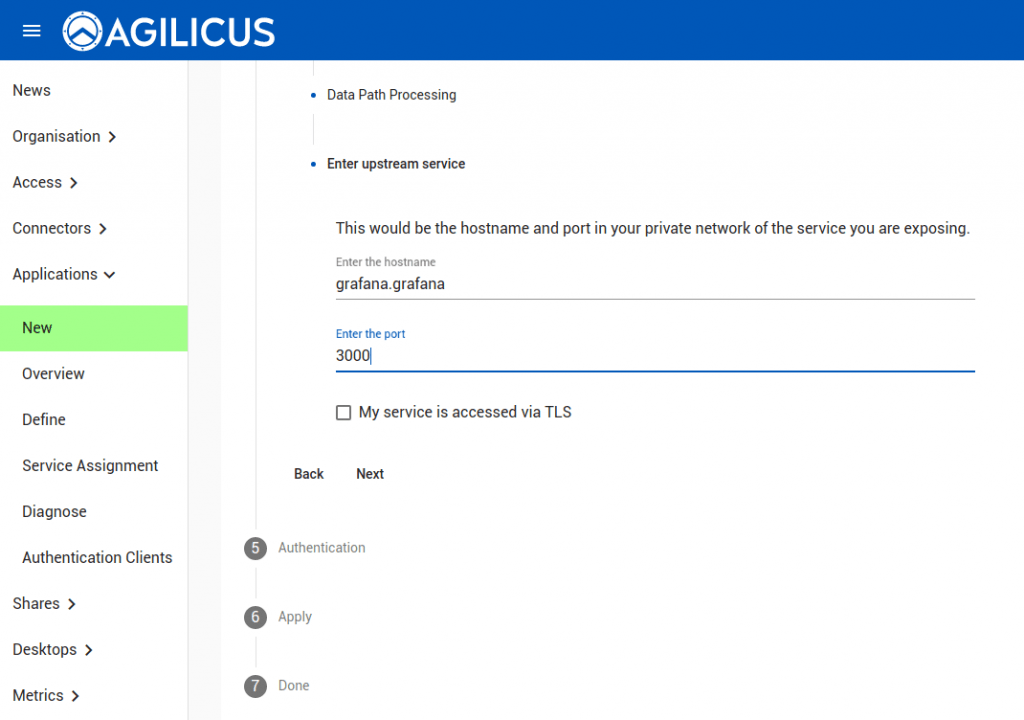
The hostname will be with respect to CoreDNS in your cluster. In this case, we have installed grafana in the ‘grafana’ namespace, so it is http://grafana.grafana:3000
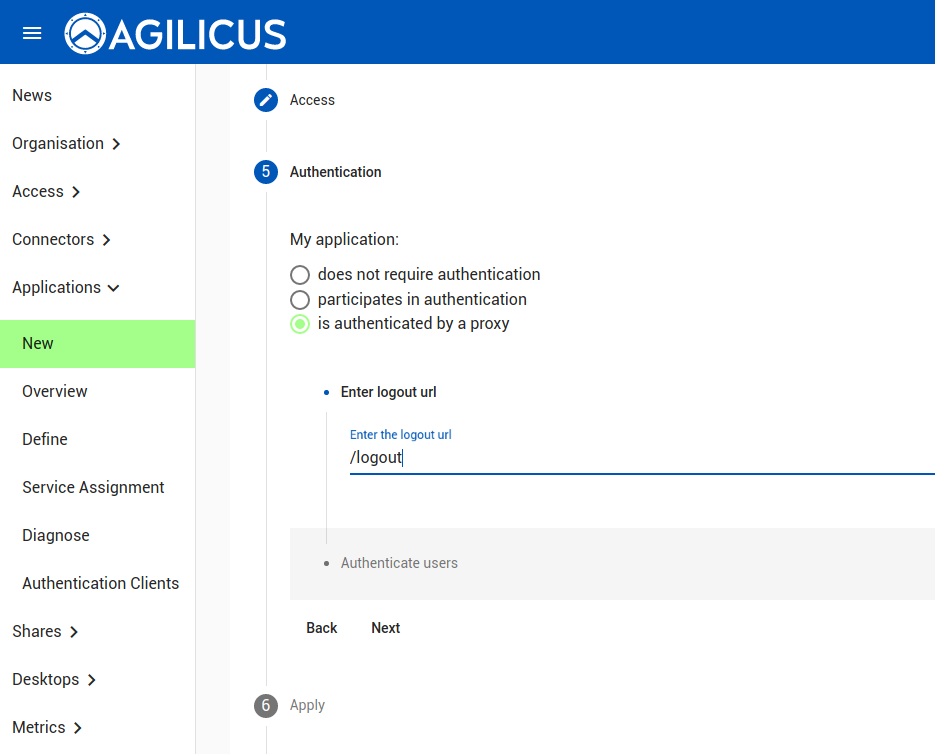
We select ‘authenticated by proxy’. In this case, no traffic will hit Grafana except for authenticated, authorised users.
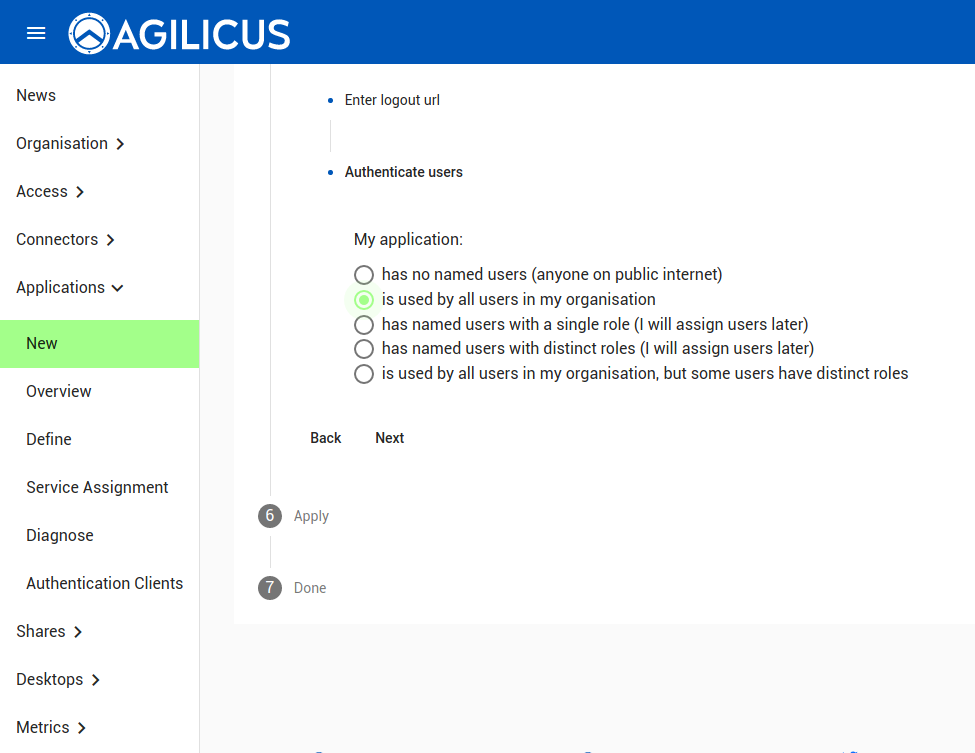
You may choose to allow everyone access, or create specific groups.
We are now complete. Hit APPLY, and wait 2-3 minutes, then enter https://grafana.MYDOMAIN in your browser.
Auto-Sign-In, Auto-User-Create (Optional)
The authenticating proxy sets various headers in a trusted fashion. These include:
Remote_org_id: <GUID>
Remote_user: <email>
Remote_user_id: <GUID>
X-Gateway-Org: <GUID>
X-Gateway-Primary-Role: <role name>
X-Gateway-Roles: <map appname: array role name>
X-Gateway-Tokenid: <GUID>
X-Gateway-User: <GUID>
X-Gateway-User-Email: <email>
In Grafana, in its config, this section can be configured. if so, the end-user will auto-login (create on first use) with no provisioning.
[auth.proxy]
enabled = true
header_name = Remote_user
header_property = username
auto_sign_up = true