Categories:
General Diagnostics,
Resource – Web Applications
In some circumstances it is more efficient to diagnose a web application issue by generating a HAR file and sharing with Agilicus Support.
Google Chrome (And Derived Browsers Like Microsoft Edge)
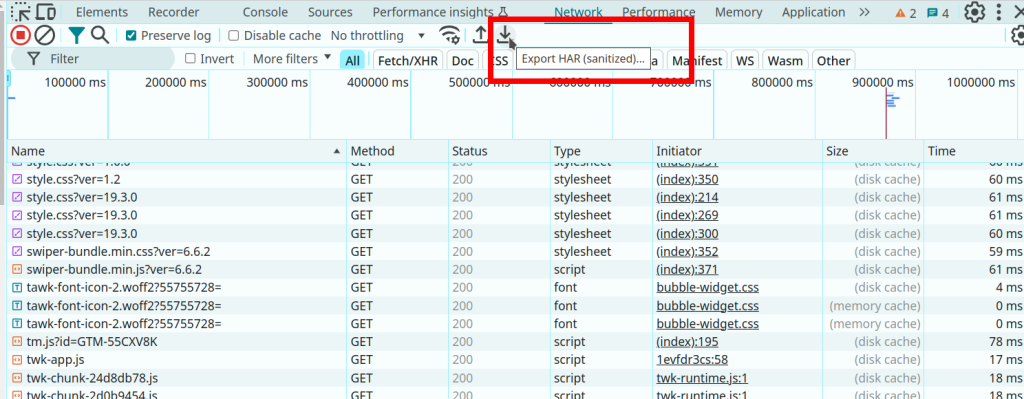
In Google Chrome (and other Chrome-derived browsers such as Microsoft Edge), you can enter the developer mode (ctrl-shift-I or F12), and then select the ‘Export HAR (sanitized)…)’ button.
- Open a new incognito window.
- Click the more actions menu (…) to the right of the toolbar and select More tools – Developer Tools (or press F12 or CTRL-SHIFT-I)
- Select the Network tab.
- Ensure that Google Chrome is recording. A red button indicates that a recording is already in progress. Otherwise, click Record network log.
- Select Preserve Log.
- Clear any existing logs by clicking Clear network log (
 ).
). - Go to the page where the issue occurred and reproduce the issue.
- Click Export HAR (the down arrow icon) to export the file as HAR.
- Save the HAR file.

Firefox
- To open the developer console in Firefox, click on the Firefox Menu in the upper-right-hand corner of the browser and select More Tools > Browser Console. You can also use Option + ⌘ + E (on macOS) or Shift + CTRL + C (on Windows/Linux).
- Refresh the page.
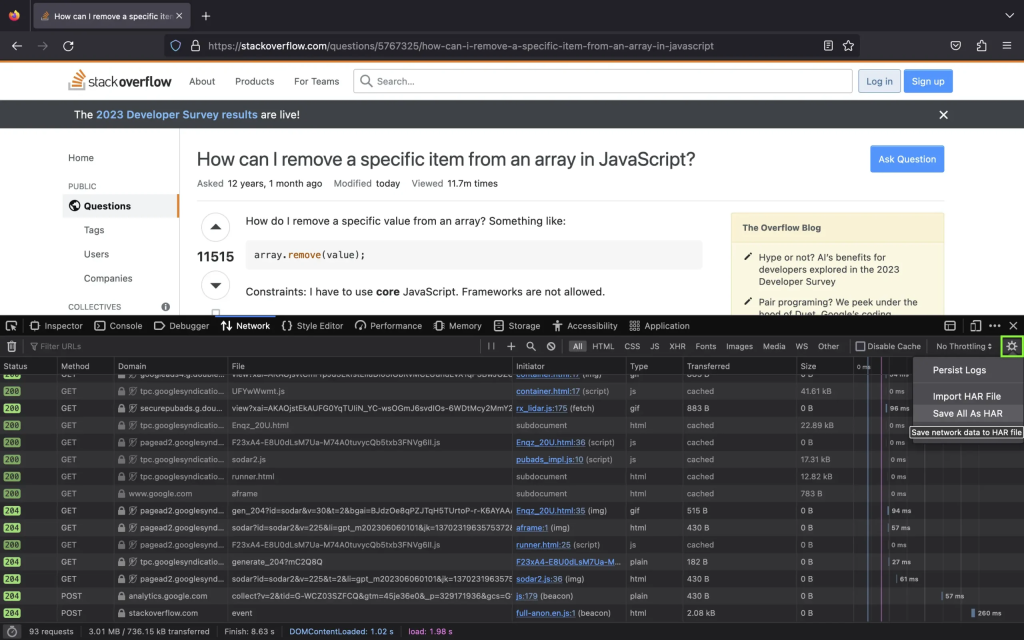
- Go to the Network tab and, click the settings icon (upper right side of the panel), choose Save All As Har.

Apple Safari
Ensure the ”Show Develop menu” in the menu bar is checked under Safari > Settings > Advanced tab.
- Visit the web page from where you want to export the traffic.
- Click Develop on the Menubar, then select Show Web Inspector. Refresh the page.
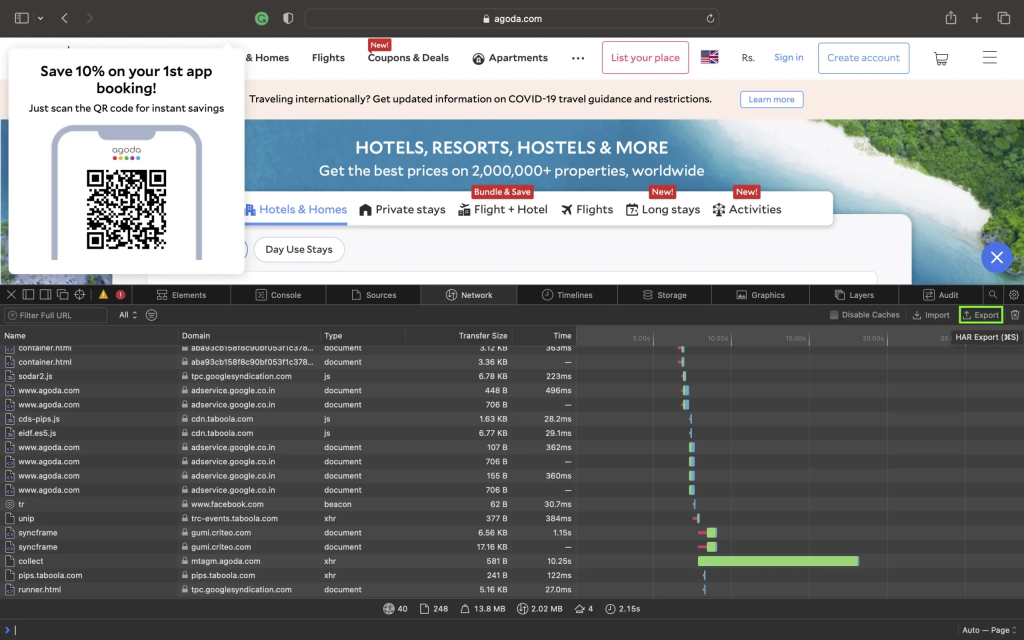
- Go to the Network tab and click Export on the upper right side of the pane.

