The performance of your website is a big factor in your success. Search engines favour fast load times, as do users. Milliseconds matter. Web site performance is as important as the content, as important as the appearance.
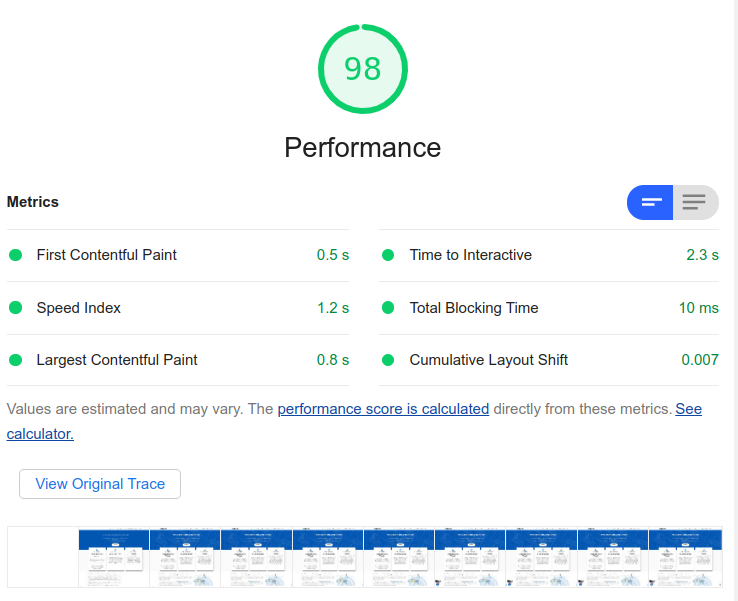
The simplest way to test your web site performance is Chrome’s Lighthouse. Open your web page, hit “Ctrl-Shift-I”. Select “Lighthouse” and, well, there you go. You get a simple report as below. It also tells you specific actions to take to improve performance (showing which images, assets, css, scripts are the culprits).
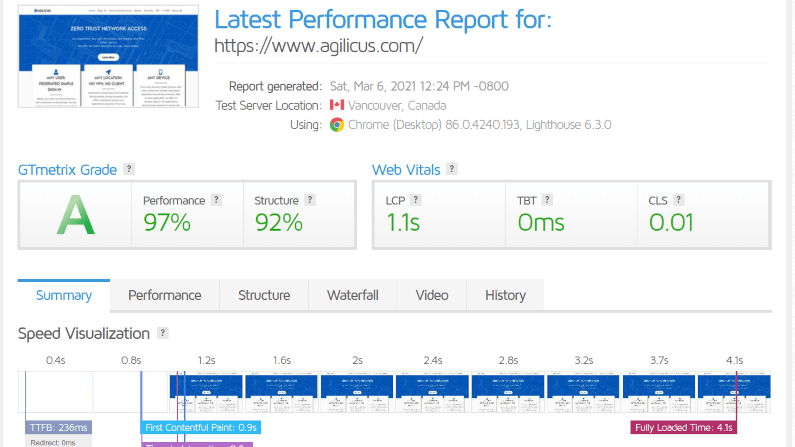
Another simple tool is GTmetrix. You head there, you type your URL, you get a report card on your web site performance.
Earlier I showed you how to load your web site. Run your performance tests while the load is high to get an accurate view of what your users will see.

You would be surprised how easy it is to get from a web site performance score of 50 to a score of 75, give it a try. The top items that I had to do included:
- Enable gzip encoding
- Remove render blocking CSS (in my case this was the wordpress dashboard icons, I disabled for non-logged-in users)
- Minify CSS and JavaScript
- Use SVG instead of JPG
- Add a Service Worker
- Increase cache duration on static assets (and use a cache-busting-naming-scheme)
- Move chat widget to onLoad event rather than in-band
- Use HTTP/2 (courtesy of Istio + Envoy)
And, well, the affect was quite strong.
The Lighthouse tool in Chrome is also good for simulating mobile conditions (which have longer latency and slower processors). It is important to optimise for the mobile handset since half or more of your traffic will come from these devices.
Now that you have optimised for speed, take a look at optmising for Accessibility: you want all users to access your content, regardless of their abilities. And look at the other best practices and Search-Engine-Optimisation hints that are given.
It doesn’t take a lot of skill or care or effort to be in the top-quartile of websites. Just a little bit of patience. Give it a go!
